
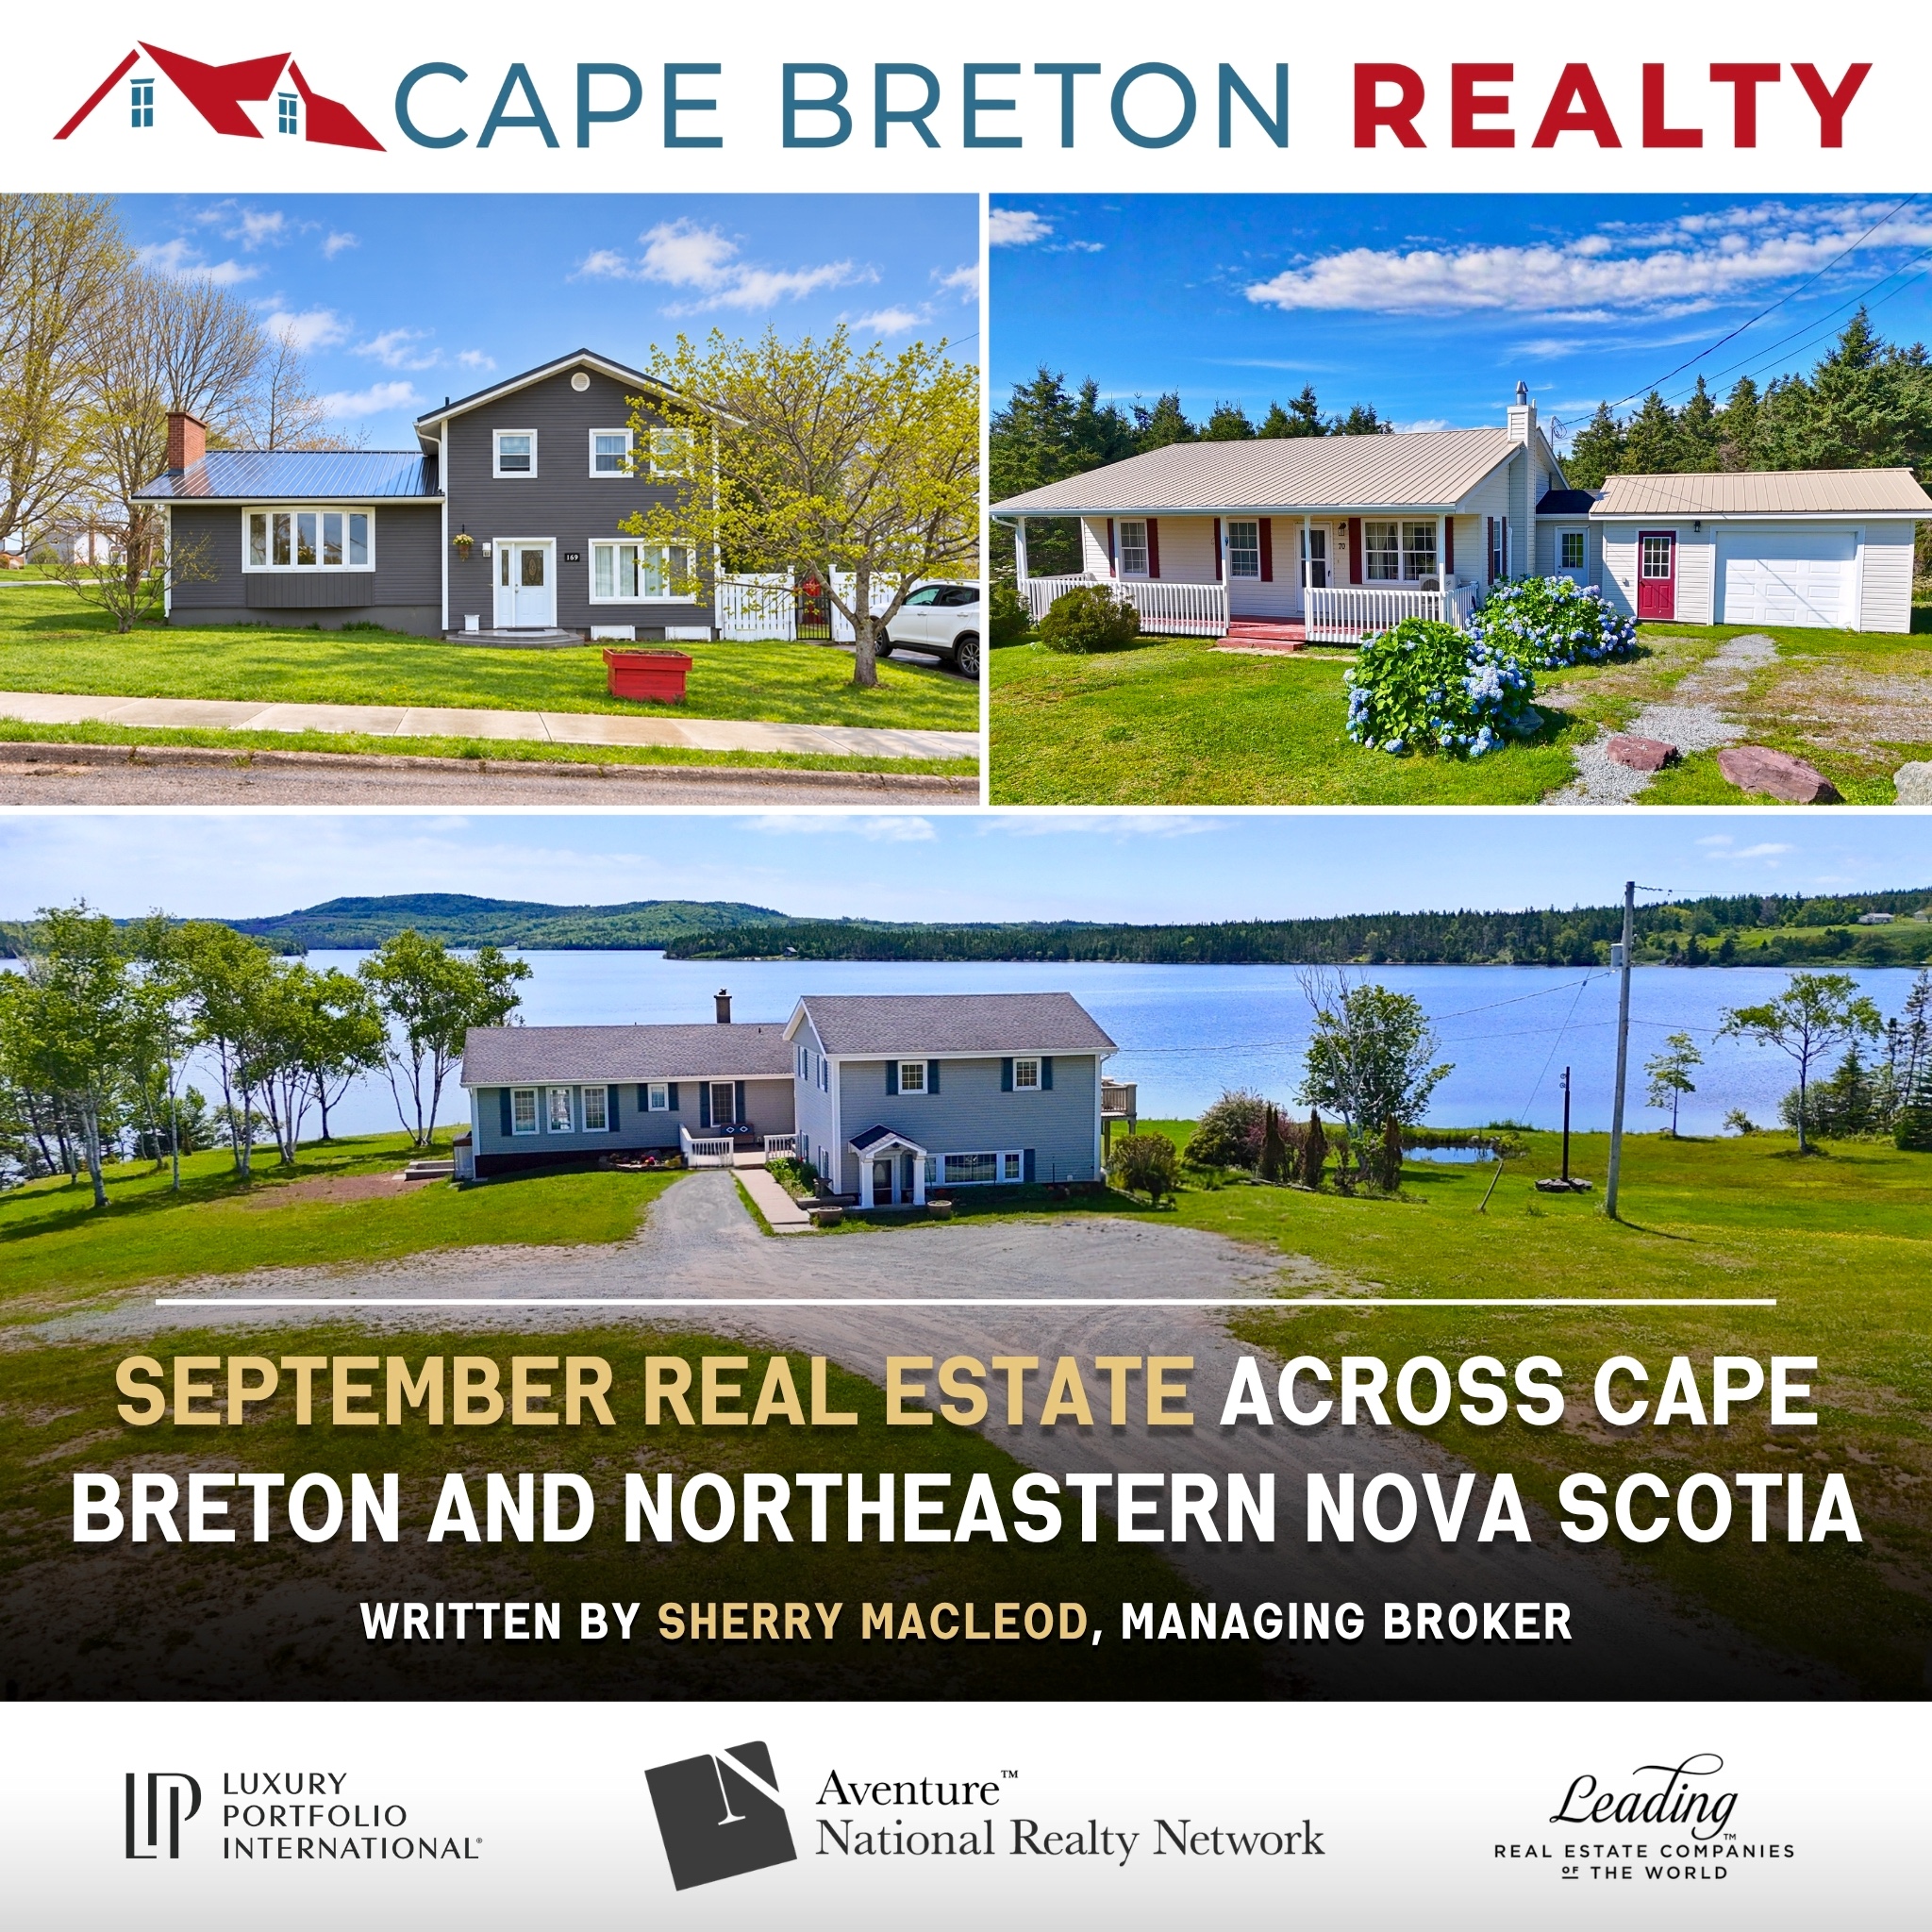
By Sherry MacLeod
Managing Broker, Cape Breton Realty
September’s real estate figures show fewer residential sales and more properties available across Cape Breton and northeastern Nova Scotia. But the results vary considerably from one community to another. For anyone thinking about buying or selling, those local differences deserve as much attention as the overall numbers.
First, we need to be clear about geography. In the Nova Scotia Association of REALTORS® report, the Cape Breton statistical region covers Cape Breton County and Victoria County. Richmond and Inverness, including Port Hawkesbury, are reported within the Highland region, alongside Antigonish and Guysborough. A headline about the Cape Breton region does not describe the whole island.
Taking these six counties together, there were 113 MLS® residential sales in September, compared with 138 in September 2025. Through the first nine months of the year, sales totalled 901, compared with 996 a year earlier, a decline of 9.5%. That longer view helps put a quieter September into perspective.
Within those totals, Inverness and Port Hawkesbury had a stronger September. Inverness recorded 12 sales, up from 10, while Port Hawkesbury recorded four, up from two. Together, that is 16 sales compared with 12, an increase of 33.3%. Their combined sales for the first nine months were still below last year, so the monthly improvement and the longer trend tell different parts of the story.
Richmond County recorded nine sales compared with 11 last September. That translates into an 18.2% decline, but it represents two fewer transactions. Having worked in this market for more than 30 years, I think that distinction matters. In a small community, a handful of transactions can make a monthly percentage change look dramatic.
Cape Breton County recorded 64 sales compared with 82, while Victoria recorded six compared with seven. Antigonish town and county together held steady at 14. Guysborough recorded four compared with 12. There is a clear slowdown in some areas, alongside steadier activity and improvements elsewhere.
The number of properties available also deserves attention. Across the six counties, there were 874 active residential listings at the end of September, compared with 728 a year earlier, an increase of about 20%. In general, that gives buyers more choice and gives sellers more competition. The selection in a particular community or price range may be quite different.
Prices need careful interpretation, too. The Cape Breton statistical region’s September average sale price was up 0.5% from a year earlier, even though sales were lower. The Highland region’s monthly average was down 17.3%, while its average for the first nine months remained 4.9% higher than last year.
Those figures describe the properties that sold in each period. They do not measure how much every individual home has gained or lost in value. With small sales totals, a change in the mix of waterfront homes, modest houses and higher-priced properties can substantially affect the average.
For sellers, my advice is to look closely at recent comparable sales and the properties buyers can choose from today. The asking price needs to make sense beside that competition. A Realtor is your best source . Presentation matters, and so does paying attention to showing feedback. If buyers repeatedly choose something else, it is time to examine why.
For buyers, a wider selection can create opportunities to compare properties more carefully and negotiate. It is still important to understand the condition of the home and the full cost of owning it. A quieter market does not make every listing a bargain, and the regional average cannot tell you whether a particular asking price is fair.
My reading of September is that this market calls for realistic expectations and good local information. Homes are selling, but the pace and choices differ across our region. Before making a decision, look beyond the headline to what has actually sold, what remains available and how your own community compares.
We are updating our website to include statistics for those interested in following these things. Watch for our revamped website coming soon
Source: Nova Scotia Association of REALTORS®, September 2026 MLS® Residential Market Activity, supplied report, pages 50, 101, 221, 230, 236, 242, 248, 254 and 260. Combined totals and percentage changes calculated from the reported figures. All comparisons are with the corresponding period in 2025.